Calculating the Real Cost of Male Suicides in India
This post attempts to present the male suicide data from an important angle, the financial one.
Summary
- The Goal
- What is not calculated?
- Scope
- The Calculation
- Step 1: How many productive males killed themselves?
- Step 2: How much productivity was lost each year?
- Step 3: Converting to Indian Rupees
- Step 4: Total productivity loss from 2003-2022
- Step 5: Adjusting for lost value due to inflation
- Step 6: Understanding the value of this number
- Step 7: Extending the lost productivity beyond the year of suicide
- Step 6: Understanding the value of this correct number
- Conclusion
TLDR: Here is the final number - ₹11,15,97,53,69,529.16
You must have seen some shocking statistics about Indian male suicides here like:
- Every 6.27 minutes, a married Indian man kills himself
- 72% of Indian suicides were male suicides
But, we see people ignoring these number, as if they are thinking (if not openly asking), “So what?”
This post attempts to present the male suicide data from an important angle, the financial one.
Let’s get started!
The Goal
Our goal here is to objectively calculate the financial loss to the nation due to lost productivity of the males who killed themselves.
In other words, we want to calculate how India would have benefited if those men had not committed suicide.
What is not calculated?
Here, our calculations don’t include any loss due to
- Loss of tax revenue that would have been collected from these men’s income
- Loss of consumption spending that would have boosted the economy
- Loss of potential innovations and entrepreneurship
- Cost of mental health support for affected families
- Loss of parental care and guidance for children
Scope
We will consider suicides from the years 2003-2022.
The Calculation
Step 1: How many productive males killed themselves?
To understand the loss due to productivity, we need to first understand how many productive males killed themselves. Here is a snapshot 👇
Assumption: We take anyone who is of age 30-59 years to be in the years of their economic productivity. So, let’s focus on them here.
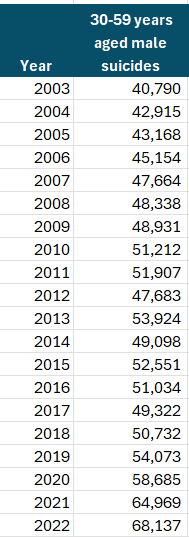
Source: National Crime Record Bureau (NCRB) - Accidental Deaths and Suicides in India Reports from 2003 to 2022.
Step 2: How much productivity was lost each year?
GDP (Gross Domestic Product) is a well-known indicator of yearly productivity around the world. We also have GDP per capita used around the world as a proxy for Productivity per person. We will use the same to derive the lost productivity.
The World Bank publishes year-wise GDP per capita for many countries. India’s report can be found here.
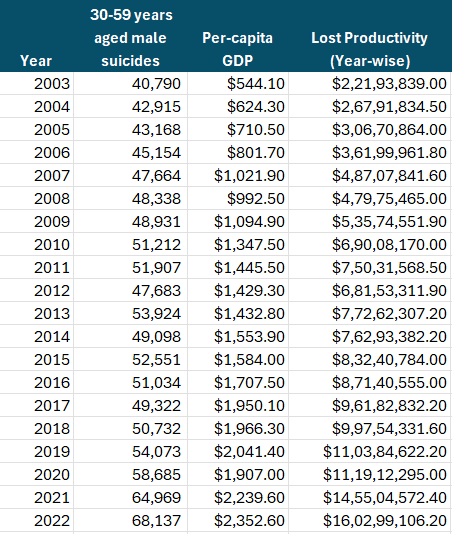
Using this, we can calculate the productivity loss every year due to male suicides of age 30-59 years.
Productivity loss for year = No. of suicides of productive males x GDP per-capita of the year
Note: This formula does not provide an accurate value for loss of productivity. However, this is a good proxy if accurate values are not readily available.
Step 3: Converting to Indian Rupees
The problem with the above data is that the numbers are in USD, that is spread over multiple years. This is not much usable if we want to compare with other financial figures in the Indian context.
So, let us try to convert all these numbers into Indian Rupees.
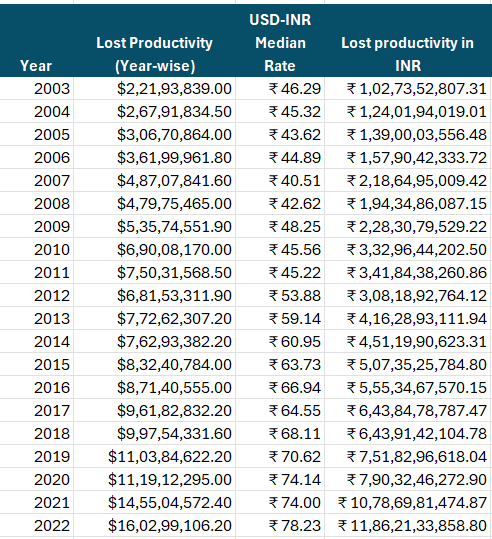
Fortunately, historical USD-INR spot exchange rates are available publicly (and downloadable too) here.
After getting this data, it is straightforward to calculate the median exchange rate for each year. (Why median and not mean? That is a whole new discussion, gist here.)
Once we calculate the median exchange rate of USD-INR each year, we can calculate the INR figures by simple multiplication of USD values with the median exchange rates.
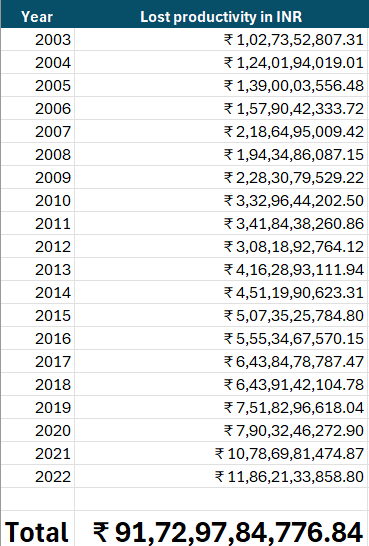
Step 4: Total productivity loss from 2003-2022
Just adding all these numbers, the total money that India has lost between 2003 to 2022 is this
Step 5: Adjusting for lost value due to inflation
The biggest problem with just adding all the years’ losses is that we are ignoring the lost value due to inflation.
If we had lost 100 rupees in 1980s, it would be equivalent to losing 2500 rupees or more today simply because, to buy an item that costed 100 rupees in 1980s, we need to spend at least 2500 rupees today.
To understand this problem better, let us see how we describe the value of goods stolen by British colonial rule from India. In this Economic Times article, there is a calculation of $9.2 trillion taken by British from India, which is equivalent to $45 trillion. This $9.2 trillion lost by India became $45 trillion when we take the current worth of the lost items.
So, it is reasonable to calculate the value lost due to inflation each year and add that year-on-year, so that the real value is expressed as of today’s worth.
Now, where do we get inflation rate data? World bank publishes this data here.
Now, with the inflation rates for each years, we can do the following calculation.
For each year, calculate how much the lost money in the previous years would have been worth. For example, lets say 100 INR was lost in 2003. It would have been equal to losing 103.80 INR in 2004 as the inflation rate for 2004 is 3.8%
Now, lets say we lose another 100 INR in the year 2004 also. Now, the total loss since 2003 as of the end of 2004 is 103.80 + 100 = 203.80 INR
Now, we reach 2005. The inflation rate for 2005 is 4.2%. So, the money lost so far will be worth 203.80 + 4.2% = 212.36 INR
And, to calculate the total money lost since 2003 by end of 2005, we need to add this 212.36 INR to the money lost in the year 2005 and so on.
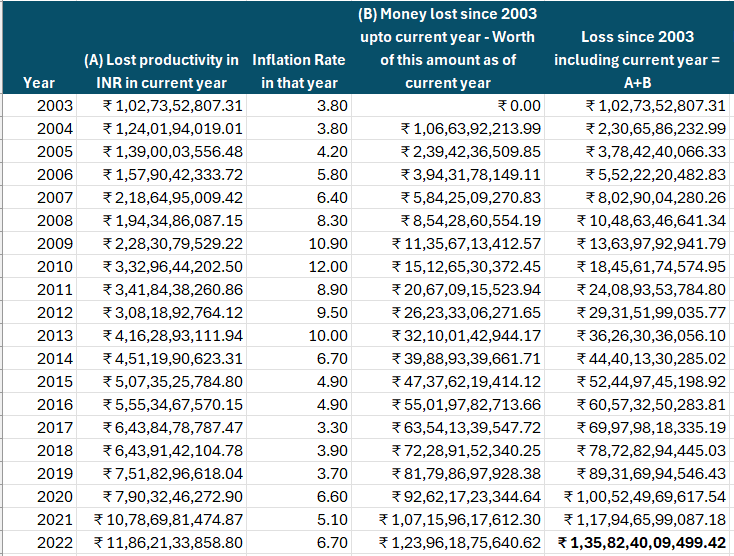
The total value comes to ₹ 1,35,82,40,09,499.42. India has lost this much money since 2003 to 2022 due to suicides of productive males.
TLDR: 1.36 lakh crores!!!
Step 6: Understanding the value of this number
To understand the value of this number, I gave the following prompt to MS Copilot AI:
Can you give me examples to compare how big this number is - ₹ 1,35,82,40,09,499.42
The output is presented below (Disclaimer: I have not checked for data errors personally)
- Public Sector Investments:
- Railway Budget: The Indian Railways’ capital expenditure for 2024-25 was around ₹2.45 lakh crore. Your amount could fund about 55.5% of this year’s railway budget.
- Education:
- Annual Education Budget: The budget for education allocated for 2024-25 was approximately ₹1.04 lakh crore. Your amount is over 1.31 times that budget.
- Healthcare:
- National Health Mission: The budget for the National Health Mission in 2024-25 was ₹36,785 crore. Your amount could fund the NHM nearly 3.69 times over.
- Sports:
- Sports Authority of India: The total budget for the Sports Authority of India in 2024-25 was around ₹650 crore. Your amount could cover the SAI’s budget for over 209 years at the current level.
- Infrastructure:
- Delhi-Mumbai Industrial Corridor: The projected cost for the entire Delhi-Mumbai Industrial Corridor project is around ₹1.08 lakh crore. Your amount is about 1.26 times the total cost of the corridor.
- Income Tax Collection:
- Annual Income Tax Collection: In FY 2023-24, the net direct tax collection (including income tax) was approximately ₹14.10 lakh crore. Your amount represents about 9.64% of that year’s collection.
- Car Industry:
- Car Sales: If we consider an average price of a new car in India at ₹10 lakh, your amount could theoretically buy 13,582,400 cars.
- Agriculture:
- Farm Loan Waivers: State governments have announced farm loan waivers in the range of tens of thousands of crores. For example, if we take Uttar Pradesh’s farm loan waiver of ₹36,359 crore announced in 2017, your amount could cover such a waiver about 3.74 times.
- Currency in Circulation:
- Total Currency in Circulation: As of recent data, the total currency in circulation in India was around ₹30 lakh crore, making your amount roughly 4.5% of the total currency in circulation.
Step 7: Extending the lost productivity beyond the year of suicide
There is one big problem in the calculations done so far. We have assumed that if a person commits suicide in 2003, the loss is incurred only in the year 2003 for his suicide.
However, the reality is that, if we had prevented his suicide, he would have been productive until he reached the age 60.
This calls for correcting our calculations by extending the lost productivity to future years too. This would mean, adding previous year suicide numbers to the following year cumulatively.
Another way to understand this is if we had prevented 1 suicide in year 2003 and 1 suicide in 2004, we would have 2 more productive people by the end of 2004. They would have produced 2 x per-capita GDP more money for India.
But, but, but, if a person was of 59 years in 2003, wouldn’t he have stopped working in 2004? It is not correct to add his suicide to losses of 2004 too. To account for this, we take an assumption that we set off 5% of all the suicide losses as retirement from previous year. The assumption here is that 5% of men would have retired in the next year due to their old age.
I know the actual number would be way less than 5% but let’s give a very liberal interpretation that will show less losses in INR now.
For example, in the year 2003, 40,790 males aged 30-59 killed themselves. But, we wont add all of them when we find “Productive males lost” as of 2004. We add only 40,790 - 5% to the year 2004.
Using this method, we can derive the numbers as follows:
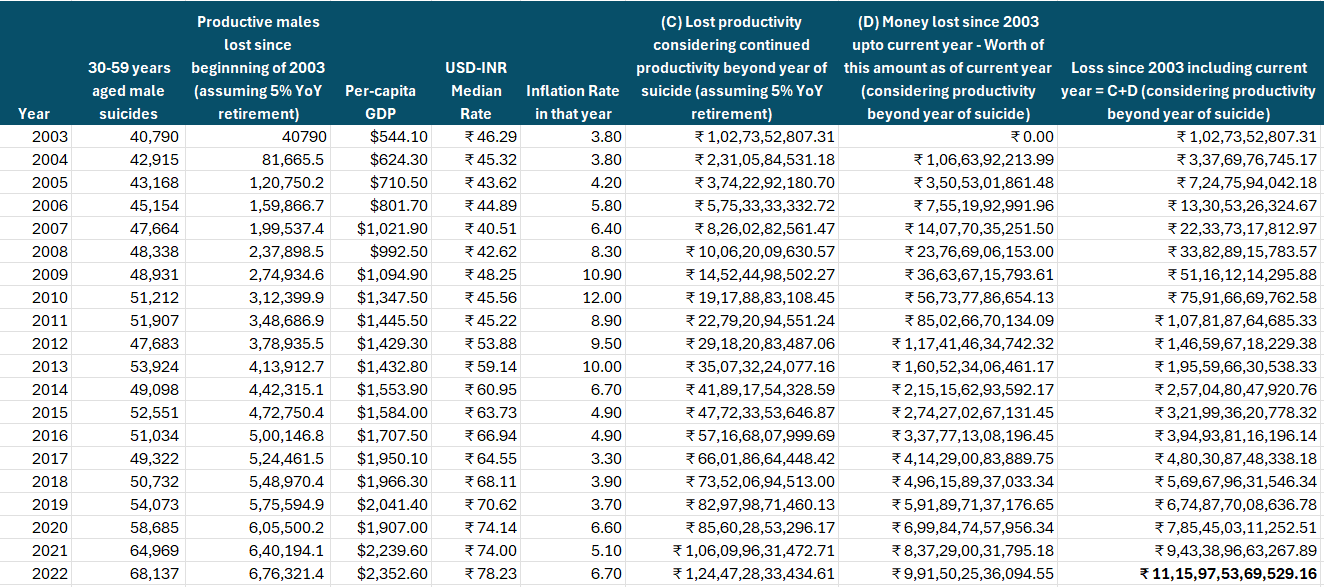
The total corrected value comes to ₹ 11,15,97,53,69,529.16. After correcting our error, we find that India has lost this much money since 2003 to 2022 due to suicides of productive males.
TLDR: 11.16 lakh crores!!!
Step 6: Understanding the value of this correct number
To understand the value of this number, I gave the following prompt to MS Copilot
Can you give me examples to compare how big this number is - ₹ 11,15,97,53,69,529.16
The output is presented below (Disclaimer: I have not checked for data errors personally)
-
India’s Forex Reserves: As of recent data, India’s foreign exchange reserves are about ₹55 lakh crore. This figure is about 20% of the entire reserve.
-
National Infrastructure Pipeline: The total investment envisaged for the National Infrastructure Pipeline from 2020-2025 is around ₹111 lakh crore. This amount could fund the pipeline approximately 10 times over.
-
National Debt: India’s total debt as of the recent fiscal year is around ₹155 lakh crore. This amount is about 7.2% of the national debt.
-
Value of India’s Gold Reserves: If we consider the value of India’s gold reserves (approximately 854.73 metric tonnes) at current gold prices, this amount is significantly larger than the value of the gold reserves.
-
Housing for All: If the average cost of a house in India is considered around ₹50 lakh, this sum could theoretically buy approximately 22 million houses, far exceeding India’s current housing needs.
-
Car Manufacturing: Assuming an average car price of ₹10 lakh, this amount could buy around 111.6 million cars, a massive number in the context of the global automobile industry.
-
Total Currency in Circulation: The total currency in circulation in India is roughly around ₹30 lakh crore, making this amount about 37.2% of the currency currently in circulation.
-
Space Program: The budget for ISRO (Indian Space Research Organisation) for 2024-2025 is about ₹13,700 crore. This amount could fund ISRO for over 81 years at the current budget level.
Conclusion
Wow! This much can happen if we prevent male suicides, that too, just the ones who are between 30-59 years of age! What if we prevent all male suicides?
Remember, this is the minimum possibility. The actual benefits could be bigger because:
- These productivity improvements will result in more tax collection
- The increased economic activity would create more jobs and opportunities
- More innovations can happen, that have compounding effect
- The emotional and psychological impact on families would be prevented
- Healthcare costs related to suicide attempts would be reduced
- The skills and experience of these individuals would continue benefiting society
- Their children would have better educational and life outcomes with fathers present
- Communities would be more stable with experienced mentors and leaders
Who wouldn’t want these? 🤷♂️
When politicians come to you asking for vote next time, ask them “Why do you NOT want all these benefits?”
Found errors?
If you find anything wrong in this calculation, feel free to throw rotten tomatoes to me on X. I am eager to correct any mistakes!
Acknowledgements
This calculation would not have been possible without Useless Millennial helping me with data collation and Jyoti Tiwari helping me with her insights on data presentation. Three cheers to each of them 👏